ANIMATIONS
Edge-to-edge precision
Glowing coloured shapes show the precision of an algorithm for modelling polygons. In addition to generating artistic figures, this new method may also lead to more realistic video animations.
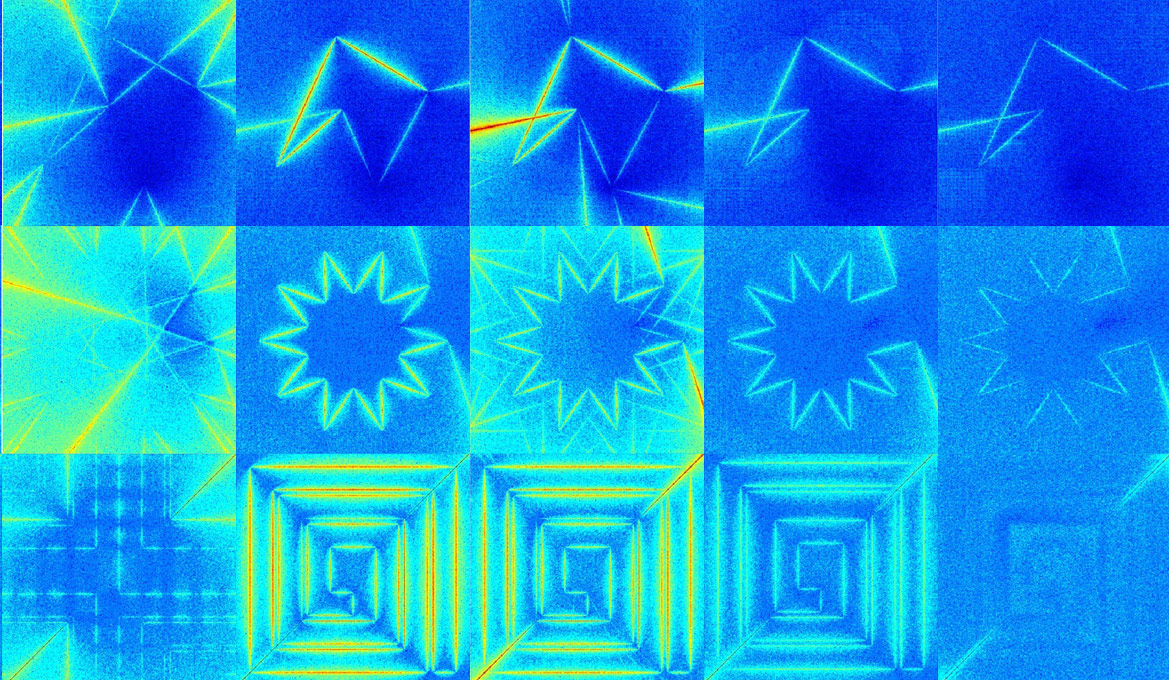
Using a colour scale to show errors in the location of points in a polygon can help improve animations. | Image: C. Fuda and K. Hormann (2024)
The more blue the points appear on this image, the more accurate is the algorithm’s calculation. The more they appear red, the greater its error. The colours in these figures taken from the work of Chiara Fuda and Kai Hormann at the Università della Svizzera italiana (USI) reflect the precision of current calculation programs for determining the ‘mean value coordinates’ for a polygon. The coordinates identify the locations of points within the shape in terms of its vertices.
They enable a precise description of the internal geometry of all two-dimensional polygons: a useful output for modelling them. “Taken into three dimensions, this method might be used for animation, as was the case for some characters in the animated film ‘Ratatouille’”, says Hormann. But as the range of colours proves that we see in the first four columns of the above collage, the current methods still produce errors, particularly towards the edges of the polygons tested. To overcome these limits, the researchers have found a new formula to calculate mean value coordinates that is more stable than earlier versions. And tests now show fewer errors, which in the fifth column of the image above adds a new shade of sapphire blue to the representations. Thanks to this step forward, 3D surfaces might be precisely rendered, Hormann says. “The quality of shape deformations will be improved, which is crucial to attaining realistic animation”.
C. Fuda and K. Hormann: A new stable method to compute mean value coordinates. Computer Aided Geometric Design (2024).